 When you are sending a configuration for the first time, you must use Send All Configurations to Switch. Do not use Send Only Modified Configuration to Switch unless you have previously sent a configuration using Send All Configurations to Switch.
You are here: SwitchKit CSA User’s Guide > 1 Getting Started > CSA Conventions

This procedure describes how you open the CSA and provides important information about saving your configurations. This section also aims to familiarize you with some of the frequently-used window views that you will see and basic conventions used in the CSA. For more details on the various monitoring views available within the CSA see the chapter, System Provisioning and Monitoring.
Before you begin
Make sure the CSA is installed on your system.
CSA is a modal interface, meaning you must highlight the module you want to operate on. By selecting a node within the LLC connection, you make that active, and all options are available to you (including Save As, and trunk windows). You don't have to open the node view. You simply have to select it.
Functionality Defined
The CSA provides easy access to configure, monitor, and provision functionality on the CSP. The functionality is defined as follows:
Ability to graphically configure a CSP from initial card layout to channel configuration.
Real-time view of a CSP used to monitor hardware status, application status, alarm status, and calls in progress.
Allows real-time changes required to maintain optimal processing on the CSP. This includes bringing components in or out of service, busying out components, and managing channel groups.
With CSA, you have the choice of configuring either offline or online. To configure offline means that the CSA is not connected to a CSP. To configure online means the CSA is connected to the LLC and SwitchManager is started. See the procedures: Adding a Node Offline and Adding a Node Online
Offline configuration:
• Requires no additional hardware or software.
• Allows you to modify existing configurations or build a new one.
Online configuration:
• Requires LLC and SwitchManager for real-time configuration and maintenance.
• Allows you to import live configuration or card population from the CSP.
• Allows you to download new configuration to the CSP.
• Allows you to modify active configuration to the CSP.
Sending or Refreshing Configuration
After you have a CSP connected to LLC, you can send or refresh your configuration changes to the CSP.
When you are sending a configuration for the first time, you must use Send All Configurations to Switch. Do not use Send Only Modified Configuration to Switch unless you have previously sent a configuration using Send All Configurations to Switch.
Four options are available for making configuration changes:
• Configuration® Configure Through SwitchMgr® Send All Configurations To Switch
• Configuration® Configure Through SwitchMgr® Send Only Modified Configuration To Switch.
• Configuration® Configure Through SwitchMgr®Refresh Configuration & Reconfigure.
• Configuration® Configure Through SwitchMgr® Refresh Configuration Without Reconfiguring.
If you select Send All Configurations To Switch, the CSP deletes its current configuration and the new configuration replaces the current one. This results in system downtime.
If you select Send Only Modified Configuration To Switch, the CSA determines which messages have changed, appends the messages to the system.cfg file and then sends only those appended messages to the CSP. This results in minimal disruption to a system.
The option, Refresh Configuration & Reconfigure, sends the configuration to the CSP, clears the system.cfg file, and then rewrites to the current system.cfg file. If you select this option, your configuration is changed immediately.
The option, Refresh Configuration Without Reconfiguring, clears the configuration in the system.cfg file, and then rewrites the current configuration to the system.cfg file. If you select this option, your configuration is changed later only when you select Send Only Modified Configuration To Switch.
The following keyboard commands are provided for use with the CSA.
|
Key strokes |
Action |
|---|---|
|
Arrows Keys |
Move the active column left or right. |
|
Ctrl+Insert |
Copy a value from the edit cell. |
|
Shift+Insert |
Paste a value to the edit cell. |
|
Limitation: Tab Key will not step in/ out of the control. |
|
Color Conventions
Colors are used consistently throughout CSA to indicate which view you are currently working on. All configuration displays are colored light blue. All monitoring displays are white. Provisioning is a subset of monitoring functionality and, therefore, is depicted with white displays.
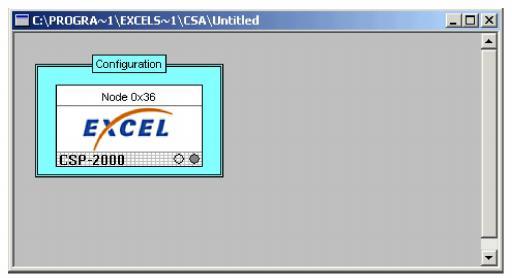
The configuration global view is opened by selecting the menu, File®New Configuration. This view displays an icon of a node that is not yet configured. To start configuration of the node, you must right-click on the icon and select Add New Node from the pop-up menu.You are then prompted to configure the IP addresses, logical node ID (valid range is: 0-254.), and node type.
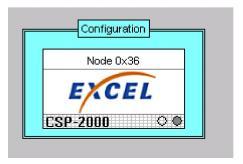
The icon in the screen below shows a graphical presentation of a configured node on a CSP. From this view, you can configure the assigned logical node ID, user defined display node name, and chassis type. The blue color indicates the node is in a configuration mode. When you select the icon, then a double line forms around the icon indicating you can perform the configuration. When your configuration is saved, the name of the icon changes to Configuration - Your Node Name.
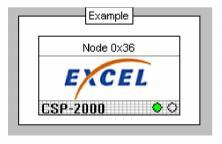
This icon represents the monitoring view of a configured node that is connected to an LLC. The white color of the node indicates it has been configured and is in a monitoring mode. From this view, you can see the chassis ID. The lights flash green on receipt of poll messages.
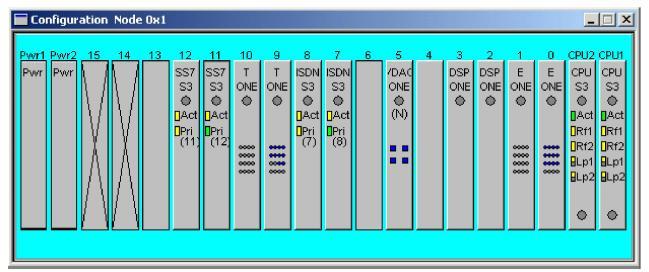
The node view, which looks similar to a CSP, is used to add and configure cards, as well as monitor the configured cards. Each card is displayed with the card type, an indicator for in-service and out-of-service, and other card specific indicators are shown:
• Line cards display span indicators.
• Matrix cards display diagnostic (DIAG) and clock indicators.
• Out-of-service cards are displayed with a red light emitting diode (LED) in the monitoring view.
You can also view the back of the panel by right-clicking within the node view and selecting Show Back View from the pop-up menu. See the next screen shot.
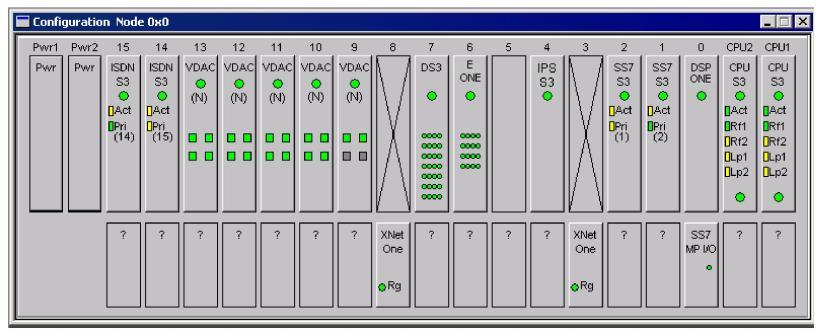
The question marks displayed on the I/O slots in the node view, signify those I/O slots have not been reported as being populated in the Card Population Query message.